Business Intelligence is a set of concepts, methods and processes to improve business decisions using information from multiple sources and applying experience and assumptions to develop an accurate understanding of business dynamics. Siliconbricks XLenz is an Excel based Business Intelligence cum Reporting tool which helps an organization manages large amounts of data, extracting pertinent information, and turning that information into knowledge upon which actions can be taken.

Siliconbricks XLenz, an Excel based Business Intelligence cum Reporting Tool is designed and developed by Siliconbricks . Siliconbricks XLenz is seamlessly integrated with all the application modules of Siliconbricks ERP from Siliconbricks . It can also be integrated with other ERPs and Applications. Besides enhancing reporting capability, Siliconbricks XLenz also addresses Business Intelligence needs to support changing business requirements and decision making process. It accesses the data captured in ERP and other applications in order for Users to view the data in their defined perspectives. Siliconbricks XLenz can greatly aid organizations analyze, report, predict, and manage business information. It combines power of user driven analytics with the power of strong database at the ERP level and ease of use of Excel.
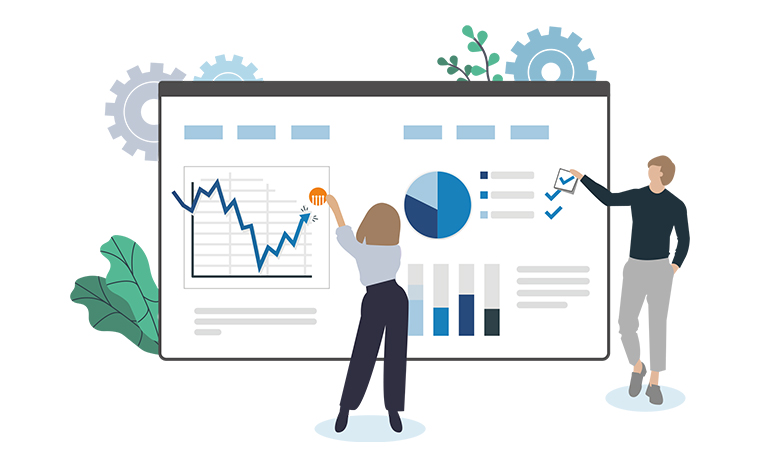


Features of Siliconbricks XLenz

1. Dynamic Decision Support Tool:
  • Enables easy data comparison and trends
  • Enables flexible and multi-level reporting
  • Enables What-If Analysis
  • Enables Exception reporting (To Identify exceptions in huge heaps of data)

2. Graphical Analytics:
  • It has several in-built graphs and dashboards
  • User can change graph types, color schemes, formatting on the fly or re-configure the dashboards
  • Users can create new graphs/dashboards from the presented data and use them to create personalized templates area
3. User Defined Data Buckets:
  • Each report has multiple parameters to select the data (or data buckets) which need to be displayed
  • User can create sub-totals at any level and for any selection of data
4. Data Drill Down:
  • Enables multiple levels of data drill down
  • Same screen toggling between summary and Detail
5. User Defined Consolidation:
  • Enables selective/complete consolidation of data for better decision making
  • User can create sub-totals at any level and for any selection of data
6. User Defined Filtering/Sorting:
  • Filter/Sort data on the fly and on the same output sheet
  • Enables dynamic changing of filters/sorting order in the same sheet
7. Personalized Templates/Data Views:
  • Enables personalized report layouts and color schemes
  • Each user can remove /hide columns or add new columns in the same report. System allows auto refresh of data just like original report
  • Same report output can be personalized by each user and stored in their respective machines, without the need of changing program logic
  • These personalized templates can easily refresh data from database whenever the user runs that report
  • Single Window interface – No Switching between menu